ON THIS PAGE
Progress0%


Our Global Presence :

Data analysis refers to evaluating raw data with a view of identifying useful information and making meaningful conclusions. It utilizes various methods and instruments to incorporate raw data and discover valuable patterns. The main purpose of data analytics is to support decision-making processes with information. There are four main types, namely descriptive analytics, predictive analytics, diagnostic analytics and prescriptive analytics models, each of which provides unique functions and viewpoints.
This article focuses on predictive and descriptive analytics, exploring the descriptive vs predictive analytics comparison, their applications, and how they help to make better decisions.
Without further ado, let’s delve in!
Descriptive analytics is the process of reviewing past data in order to identify trends and patterns. It is concerned with briefly summarizing past occurrences to provide a clear picture of what had already taken place in an organization. By structuring and analyzing massive information, it offers an opportunity for stakeholders to perceive the big picture and identify meaningful insights.
In practice, descriptive analytics uses statistical techniques and visualization tools (charts, graphs, and dashboards) to share information in a simple and transparent format. These tools are frequently integrated with machine learning development services to enhance scalability and precision in data interpretation. The main objective is to provide insights which would assist in making informed decisions and shape strategic initiatives.
Descriptive analytics involves gathering and analyzing historical data from multiple sources. The data is firstly cleaned and formatted to ensure that it will be consistent and accurate. At the end of the preparation process, statistical techniques are utilized in order to find out patterns and trends embedded in the data.
Some common approaches include determining measures such as mean, median, mode, and standard deviation. Furthermore, data visualization tools such as bar charts, line graphs, and pie charts are implemented to present the results in an easy-to-visualize manner. These visuals facilitate the understanding of insights by stakeholders and promote data-driven decision making, often complementing Machine Learning in Business Intelligence systems that integrate descriptive findings for advanced forecasting and strategy optimization.
Descriptive analytics is broadly applied in various industries to analyze past information and identify important trends. In the healthcare industry, it helps in analyzing patient records to identify trends in disease occurrence. In the financial field, it helps to determine how the market is functioning and make a recapitulation of past investment outcomes.
Other major applications include classification of customers using machine learning for customer segmentation to analyze behavior patterns in marketing, player and team statistic analysis in sports, and tracking of production output to increase efficiency in manufacturing. In addition, descriptive analytics is utilized in education to research student performance data, in retail to evaluate the trends in sales, and in transportation to research the strength of traffic and tracks. Through the use of descriptive analytics, organizations are able to gain actionable insights from operations that shape decision making and enhance results.
Predictive analytics is an analytics technique that goes beyond describing historical events by using data; it is concerned with prediction of future outcomes based on past and current data. This approach uses tools such as statistical modeling, machine learning models, and data mining techniques to detect patterns and trends that guide future prediction. The primary objective is to develop insights that will allow organizations to make informed, forward-looking decisions.
Predictive analytics help retailers with predicting buying behaviors, managing stock, and providing personalized experience to customers. For example, it may also assist in the prediction of product demand during holiday seasons thus minimizing the risk of such an occurrence.
The process through which predictive analytics works follows a set of critical stages. It starts with collecting and organizing data to be used. After this, the given information is analyzed with the help of statistical analysis and machine learning techniques ( including distinctions like supervised learning vs unsupervised learning) in order to find out patterns, trends, and correlations. From these insights, predictive models are created for the prediction of future happenings or behaviors.
These models are continuously tested, refined and validated to ensure their accuracy and dependability. Once finalized they are deployed to make informed predictions and help with decision making.
Predictive analytics is commonly used in different industries to improve efficiency and decision making processes.In manufacturing, predictions of equipment failures, proactive scheduling of maintenance, and optimization of production processes are the key outcomes obtained. The transportation industry uses predictive analytics to predict traffic patterns, optimize route planning, and minimize delivery periods.
In the insurance industry, predictive models help in determining the policyholder risk, the appropriate setting of premium, as well as determine fraudulent claims. To implement these advanced models, many organizations partner with machine learning consulting firms to design tailored solutions that align with industry-specific challenges and goals.
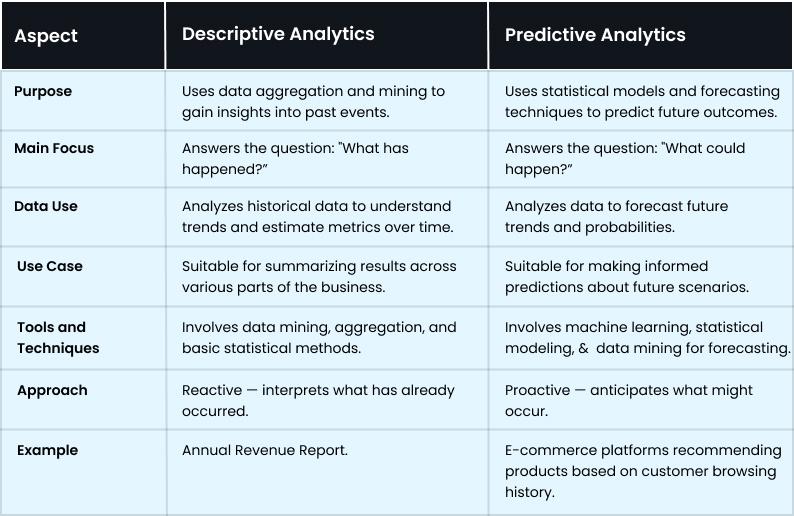
The difference between descriptive and predictive analytics is fundamentally based on their purpose. Descriptive analytics aims at explaining and generalizing past data to understand what has occurred, whereas predictive analytics are aimed at modeling what might occur in the future. Understanding this difference is crucial to any organization that intends to make informed data-driven decisions.
Additionally, the tools and methodologies applied in each of the approaches differ completely. Descriptive analytics usually applies statistical analysis and the analysis of data visualizations to present insights from previous data. On the other hand, predictive analytics uses more complex techniques like machine learning (often advanced by machine learning development companies), high statistics, and data mining to predict future events. By understanding these differences, organisations are empowered to choose the best strategy according to their goal.
Descriptive and predictive analytics play a part of the data strategy of any organization. Descriptive analytics assist in interpreting past data for the purpose of identifying patterns and trends, while predictive analytics utilize statistical models and machine learning to predict future events. Learning both approaches helps organizations leverage data to create actionable insights in favor of making smarter decisions.
At Debut Infotech, our focus is on providing embedded analytics & business intelligence solutions for AI and machine learning environments. We offer AI-driven applications to provide businesses with the use of real time data and high level of reporting environment. By integrating cutting-edge machine learning platforms and using well-proven best practices, we help organizations leverage their data to its full potential and achieve accelerated AI initiatives.
Descriptive analytics focuses on analyzing historical data to explain what has already happened, providing valuable context and clarity. In contrast, predictive analytics uses data, statistical models, and machine learning to anticipate future trends and outcomes, though it often faces machine learning challenges such as data quality and model accuracy. Understanding this distinction in descriptive vs predictive analytics is vital for organizations aiming to make informed, forward-thinking decisions. Additionally, each approach relies on different methodologies and tools tailored to its purpose.
Descriptive, diagnostic, predictive, and prescriptive analytics each play a unique role in helping organizations extract maximum value from their data.
Descriptive analytics centers on analyzing past workforce data to understand trends and performance. In contrast, predictive analytics, driven by advancements in machine learning trends, uses those patterns to anticipate future outcomes, such as employee turnover or performance, helping HR teams make proactive decisions.
Descriptive analytics often involves metrics such as year-over-year price variations, month-over-month sales increases, user count, or average revenue per subscriber.
Predictive analytics typically relies on two primary model types: classification and regression.
Descriptive analytics helps us understand what has already occurred, while predictive analytics focuses on what is likely to happen next.
Predictive analytics employs a range of methods including regression analysis, data mining, classification algorithms, neural networks, and time series forecasting to uncover patterns and generate forecasts about future outcomes.
Google Analytics 4 helps you understand how visitors discover and navigate your website. With these insights, you can identify opportunities to improve your site’s performance and user experience.
– Nominal Data – A form of qualitative data used for labeling or categorization without any order.
– Ordinal Data – Another type of qualitative data where the values have a meaningful order, but the intervals between them are not consistent.
– Discrete Data – A type of quantitative data that consists of distinct, countable values, often representing whole numbers.
– Continuous Data – A quantitative data type that can take any value within a range and is -measurable, not just countable.
Our Latest Insights
USA
2501 Chatham, Rd Suite R Springfield, IL 62704
+1-708-515-4004
info@debutinfotech.com
UK
7 Pound Close, Yarnton, Oxfordshire, OX51QG
+44-770-304-0079
info@debutinfotech.com
Canada
326 Parkvale Drive, Kitchener, ON N2R1Y7
+1-708-515-4004
info@debutinfotech.com
INDIA
Sector 101-A, Plot No: I-42, IT City Rd, JLPL Industrial Area, Mohali, PB 140306
9888402396
info@debutinfotech.com
Copyright © 2026, Debut Infotech. All rights reserved. | Privacy Policy